
“PW-Viz”
our new Data visualization tool!
Weʻve been working with bioinformatician, Ethan Hill, to turn our decade of fish survey data into a data visualization tool with live updating graphs and charts!
Ultimately, we hope this data viz tool will...
give users an opportunity to interact with all current and historic data in a more accessible way.
give users an opportunity to choose how to organize the data using toggle drop down menus to view data through various lenses such as the stream sites, species, HS-IBI scores, and individual school impact
allow users to download graphs and charts depicting various trends that can be used as formative and summative assessment of students learning
provide teachers a tangible, stewardship focused, real world tool for nurturing studentʻs data literacy and inquiry about stream health related issues.
encourage teachers and students to pin point key data trends to formulate their own scientific questions and develop investigations through enduring stewardship projects in our streams.
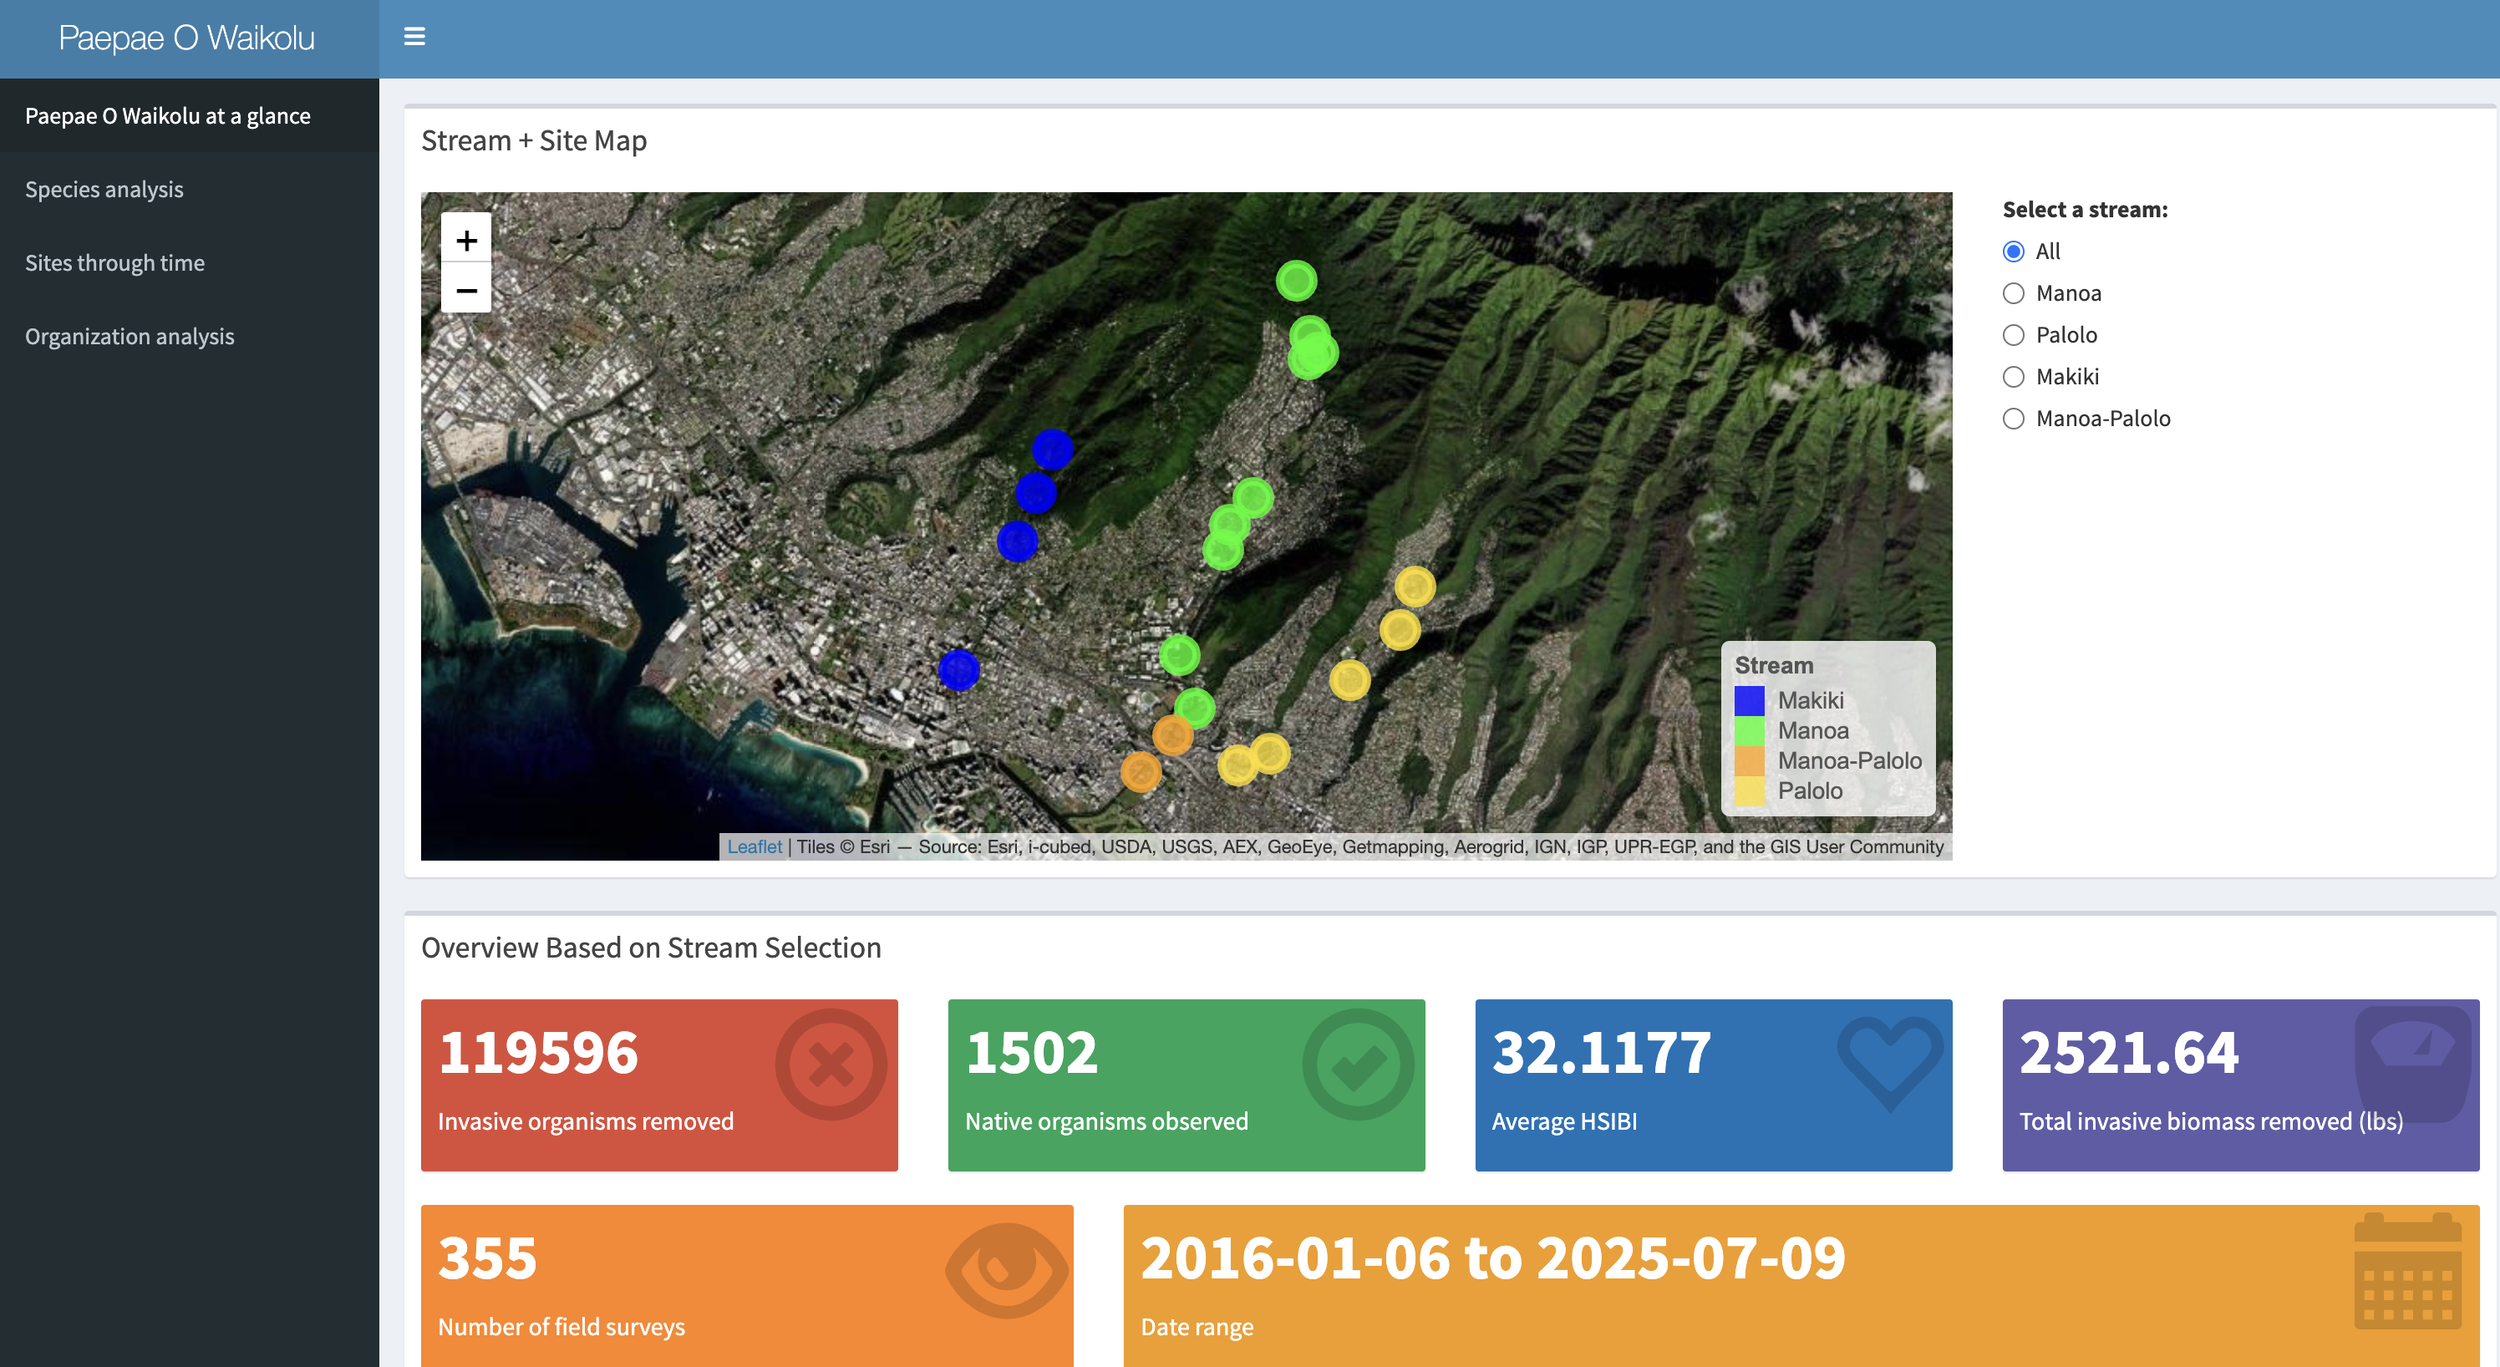
[Biodiversity Summary][Database][Graphs]
Click on the above image view mapped icons. To view a static graph and link to interactive data summary for each study site, click on “magnifying glass” icons. Some smart-devices may have difficulty visualizing the interactive resources.

Click on image above to access table and graphical summary for the total number of each species found at each site.
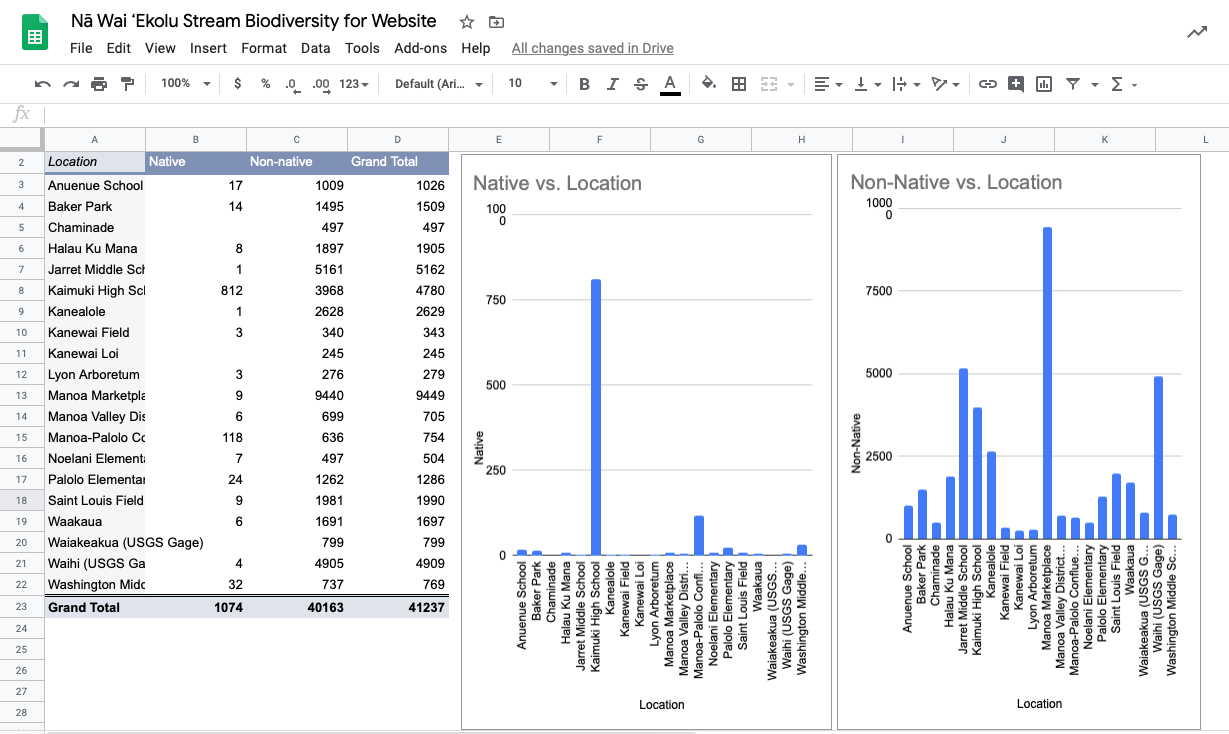
Click on image above to access table and graphical summary for total native and non-native species found at each site.